


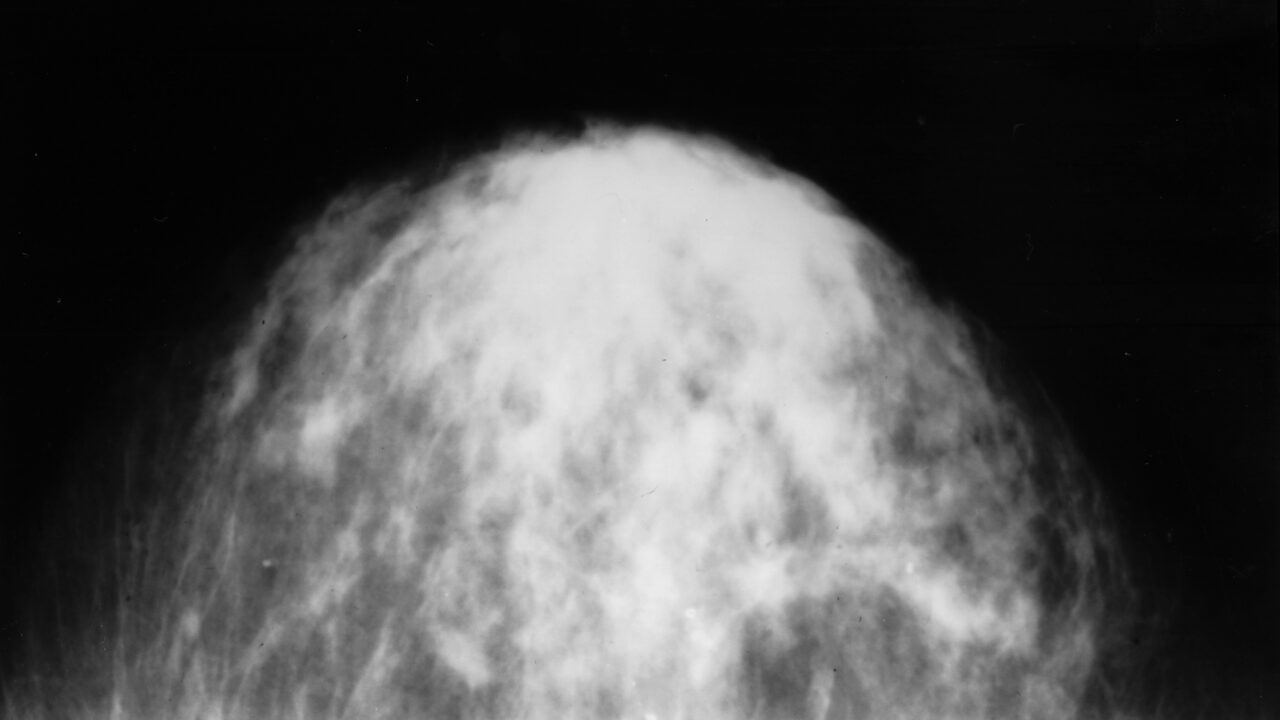
Every cancer statistic you have ever read, cases per hundred thousand, survival trends, differences between states and communities, begins as a medical record in a clinic somewhere in America. In this explainer from the Centers for Disease Control and Prevention, the CDC walks through how the United States Cancer Statistics are assembled, the official federal numbers that combine registry data from across the country into a single, comparable picture.
The process matters more than it might sound. Cancer registries collect standardized information on diagnoses reported by hospitals, laboratories and physicians. Federal analysts then clean, link and check those records against strict publication criteria so that a rate published for one state can fairly be compared with another, and so that a change over time reflects real change rather than a shift in paperwork. The video outlines where the numbers come from, how they are verified, and how researchers, clinicians and the public can explore them through the CDCs data visualization tools.
Watch for the distinction the CDC draws between counting and interpreting. A rising case count can mean more disease, better detection, an aging population, or all three, and the agencys technical notes exist precisely to keep those possibilities separate. For anyone who has wondered why official figures lag the calendar by a couple of years, the answer is in this pipeline: completeness and accuracy are traded against speed. It is a quiet, essential piece of public health infrastructure, explained by the people who run it.
Credit: Centers for Disease Control and Prevention (CDC)